Digital Twin of the Ocean: Transforming Environmental Monitoring in Trondheim Fjord
September 22nd, 2024
In recent years, the world of environmental monitoring has witnessed a significant transformation, largely driven by technological advancements in digital twin technology.
One remarkable application is the development of the Digital Twin of the Ocean (DTO). This technology offers a detailed, real-time virtual replica of ocean environments, enabling better management, prediction, and conservation of marine ecosystems.
A notable example of this is the Trondheim Fjord Water Quality Pilot, a pilot that’s part of the EU-funded project Iliad. Situated in Norway’s Trondheim fjord, this pilot project showcases the power of DTOs in environmental monitoring, particularly for water quality assessments. But what exactly does this entail? And how does the Trondheim fjord pilot leverage DTO technology for sustainable ocean management?
A DTO is a digital replica of ocean environments, integrating data from sensors, historical records, and numerical models to simulate real-time and predictive scenarios. In simpler terms, a DTO helps monitor and analyze ocean ecosystems by syncing virtual simulations with actual data collected from the ocean, helping predict the future and respond to immediate environmental challenges.
The Trondheim fjord pilot uses an array of tools, including surface and benthic observatories, Autonomous Underwater Vehicles (AUVs) to collect data on water quality, pollution, and biological events. This information is fed into a data pipeline and visualized using cutting-edge software, allowing stakeholders to interact with real-time data through visual dashboards.
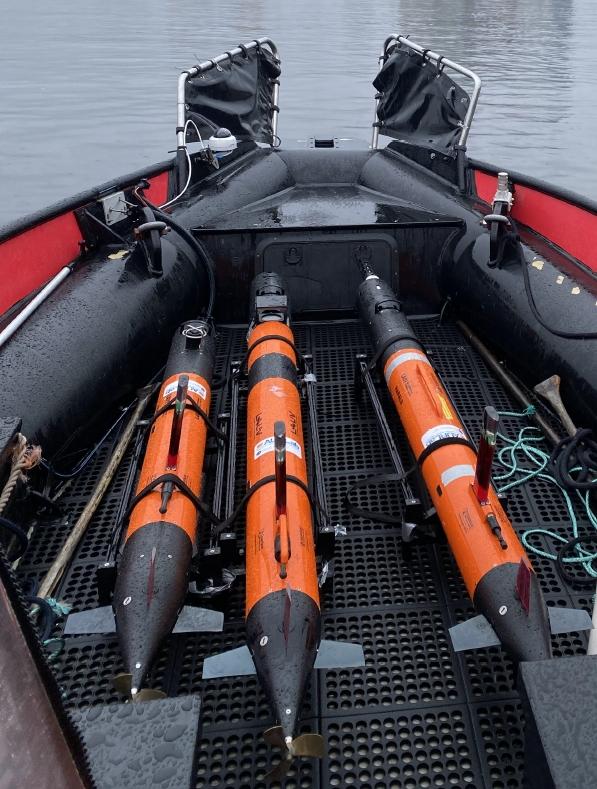
AUVs are used to collect more comprehensive data. | Photo By: Jens Einar Bremnes
How Does the Trondheim Fjord Pilot Work?
At the core of this project lies a sophisticated infrastructure that consists of stationary and mobile sensor platforms that provide continuous data on ocean conditions, such as temperature, salinity, and ocean current. They also monitor pollutants like microplastics and track biological events like algae blooms. When specific environmental events are detected (e.g., an algae bloom), mobile sensors can be deployed on AUVs to cover larger areas and gather detailed data. The collected data is stored in a centralized database, analyzed using advanced machine learning algorithms e.g., particle classification (zooplankton or microplastic), and visualized using tools like Grafana. This approach allows researchers and stakeholders to monitor trends, set alerts, and even run “what-if” scenarios to predict future environmental changes.
Algae Bloom and Microplastic Monitoring
Two standout case studies from the pilot are its work in monitoring algae blooms and detecting microplastics. Algae blooms, often caused by nutrient runoff or rising ocean temperatures, can have devastating effects on marine ecosystems. By using sensors, the Trondheim fjord pilot detects early signs of algae blooms and deploys AUVs to collect more comprehensive data, allowing for real-time intervention.
Similarly, microplastic detection has become a priority for ocean health. The pilot utilizes cutting-edge particle sensors to identify and track microplastics in the water. By categorizing the size and types of particles, researchers can trace their movement across the fjord and predict their long-term environmental impact.
This is where “OpenDrift” comes into play. OpenDrift is an advanced modeling tool used to simulate the transport and fate of particles in the ocean. By integrating real-time ocean current data and particle characteristics, the pilot is able to forecast the movement of microplastics or algae in the water. The ability to predict where these particles will drift enables more informed decision-making and helps mitigate environmental impacts before they worsen.
Visualization and Interaction: The Power of Grafana and Gaming Technology
One of the most exciting aspects of the Trondheim fjord pilot is its interactive visualization platform. Using Grafana, stakeholders can interact with real-time data, view video streams, and monitor ocean conditions on a virtual dashboard. This level of accessibility not only empowers decision-makers but also encourages a broader range of stakeholders—including industries like aquaculture and insurance—to use the data for their operations and risk assessments.
Additionally, the pilot explores a novel gaming-based approach to interactive visualization. By using game engines like Unity and Cesium, complex data such as particle movement in the ocean is rendered in a 4D immersive environment. This enhances user engagement, allowing researchers and decision-makers to visualize and interact with ocean data in an intuitive and dynamic way.
The Future of DTO in Marine Research
The Trondheim fjord pilot is just one example of the immense potential of Digital Twin technology in ocean monitoring. As the project evolves, its focus will be on enhancing data interoperability, automating alert systems, and further integrating predictive models. The project’s next steps involve applying similar technology in other ocean areas and extending its impact across different marine industries.
In a world increasingly concerned with environmental sustainability, the digital twin of the ocean presents a promising avenue to safeguard marine ecosystems. As data and technology continue to advance, projects like the Trondheim fjord pilot offer a glimpse into the future of how we monitor and protect our oceans.
The post is based on the research article titled "A Digital Twin of the Trondheim Fjord for Environmental Monitoring – a pilot case" published by Iliad partners.